Opencv ,matplotlib interactive thresholding finding in jupyter python
In this we will see how to use opencv , matplotlib.pyplot and ipywidgets to make interactive threshold finding real time in jupyter.
import cv2
import matplotlib.pyplot as plt
from ipywidgets import interactive
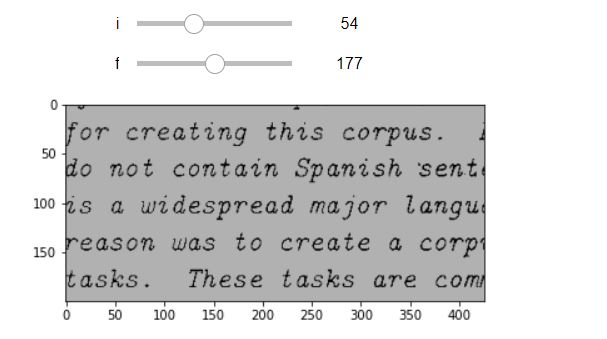
def f(i,f): # i is for lower limit f is for the upper limit of threshold
img = cv2.imread('scanned.png')
hi,threshold = cv2.threshold(img,i,f,cv2.THRESH_BINARY)
#cv2.imshow('thresg',threshold)
plt.imshow(threshold,cmap='gray')
#cv2.waitKey()
#cv2.destroyAllWindows()
interactive_plot = interactive(f, i =(0,150),f=(100,255))
interactive_plot
use the slider to control thresholding


0 Comments
if you are not getting it then ask i am glad to help