3d mexican Graph hat animation in python matplotlib
In this blog we are going to learn how to plot 3d graph animation in matplotlib.pyplot
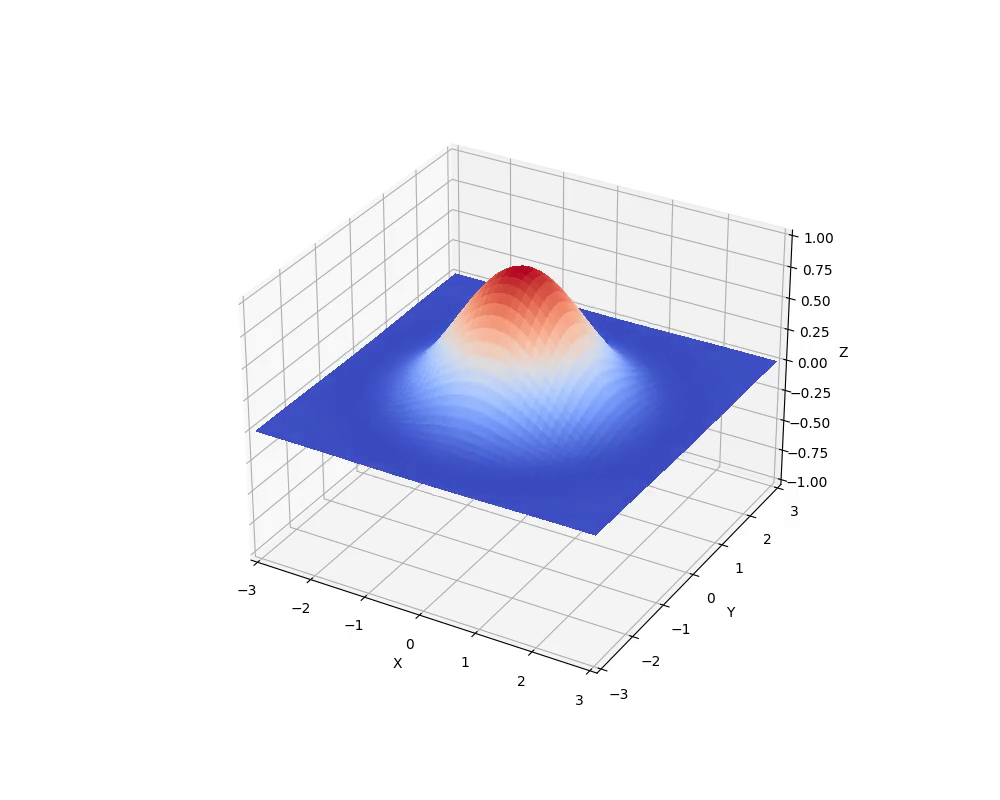
Code :
import numpy as np
import matplotlib.pyplot as plt
from mpl_toolkits.mplot3d import Axes3D
from matplotlib.animation import FuncAnimation #animate 3d graph
import matplotlib.animation as animation # save the animation
fig = plt.figure(figsize=(10,8))
ax = fig.add_subplot(111, projection='3d')
ax.set_xlim([-3,3])
ax.set_ylim([-3,3])
ax.set_zlim([-1,1])
def update(num):
ax.clear()
ax.set_xlim([-3,3])
ax.set_ylim([-3,3])
ax.set_zlim([-1,1])
ax.set_xlabel("X")
ax.set_ylabel("Y")
ax.set_zlabel("Z")
x = np.linspace(-3, 3, 100)
y = np.linspace(-3, 3, 100)
X, Y = np.meshgrid(x, y)
Z = np.exp(-(X**2 + Y**2) / 2) * np.cos(np.pi*num/10*(X**2 + Y**2))
surf = ax.plot_surface(X, Y, Z, cmap='coolwarm',linewidth=0, antialiased=False)
return surf
ani = FuncAnimation(fig, update, frames=np.linspace(0, 10, 100), blit=False)
ani.save("animation.mp4", writer = animation.FFMpegWriter(fps=30))
plt.show()


0 Comments
if you are not getting it then ask i am glad to help